The analysis of the obtained data according to the studied climatic factors
In the investigated towns, during the studied period, they observed significant differences form one year to another between the average values (individuals) during the three years of registering in Timisoara (F=31,00; p=0,000), Gătaia (F=23,74; p=0,000), Şimand (F=24,32; p=0,000), Covăsânţ (F=16,48; p=0,000), Chelmac (F=13,29; p=0,000), Gura Vaii (F=4,08; p=0,000), Varfurile (F=10,45; p=0,000), Prisaca (F=20,41, p=0,000), Negreni (F=4,75; p=0,031), Teregova (F=4,65; p=0,010), Budureasa (F=8,50; p=0,004), Domaşnea (F=7,44; p=0,001).
In the following towns : Şoimi (F=2,76; p=0,065), Blaja (F=0,22; p=0,641), Gurasada (F=0,17; p=0,679), Nusfalău (F=2,05; p=0,154), Reşita (F=0,15; p=0,865), Vălişoara (F=1,12, p=0,291), they observed the differences were insignificant.
The descriptive processing on which the analysis was made can be seen in the following tables and diagrames. This shows the minimum values, the high values, the average values and the standard deviation of the registered captures in the investigated towns in 2010.
The descriptive analysis of the registred data (sample/traps) in towns /altitudes in 2010
| Statistical interpretation |
Version Town/height |
Number of days |
Minimal values |
Maximum values |
Average |
Standard deviation |
Timisoara 2010 (110 m) |
91 |
,00 |
101,00 |
24,0626 |
28,98939 |
Gataia 2010 (115 m) |
91 |
,00 |
109,00 |
25,4835 |
30,35907 |
Simand 2010 (116 m) |
91 |
,00 |
197,00 |
53,5788 |
58,02334 |
Covasant 2010 (134 m) |
91 |
,00 |
103,00 |
25,1576 |
32,60499 |
Chelmac 2010 (140m) |
91 |
,00 |
99,00 |
20,3438 |
23,65601 |
Soimi 2010 (145 m) |
91 |
,00 |
87,33 |
17,1132 |
20,91012 |
Blaja 2010 (150 m) |
91 |
,00 |
98,33 |
28,7873 |
29,65500 |
Gura Vaii 2010 (164 m) |
91 |
,00 |
37,67 |
8,4581 |
9,51687 |
Gurasada 2010 (183 m) |
91 |
,00 |
54,00 |
16,7069 |
14,74208 |
Nusfalau 2010 (214 m) |
91 |
,00 |
31,33 |
9,7656 |
8,64566 |
Varfurile 2010 (228 m) |
91 |
,00 |
39,67 |
6,5200 |
8,99153 |
Prisaca 2010 (270 m) |
91 |
,00 |
55,33 |
13,1685 |
14,42088 |
Resita 2010 (305 m) |
91 |
,00 |
36,00 |
10,2338 |
10,52781 |
Negreni 2010 (388) |
91 |
,00 |
21,67 |
7,1831 |
7,38151 |
Teregova 2010 (401 m) |
91 |
,00 |
32,33 |
7,1280 |
8,63412 |
Budureasa 2010 (392 m) |
91 |
,00 |
26,00 |
5,2341 |
7,08566 |
Valisoara 2010 (435 m) |
91 |
,00 |
17,00 |
4,1464 |
4,98641 |
Domasnea 2010 (557) |
91 |
,00 |
22,33 |
4,3114 |
6,14333 |
The analysis of the environmental factor correlation
As a result of the environmental factor analysis on the average number of daily captures, one can observe that at the level of each studied town (altitudes), there were registred direct positive correlations of litlle intensity towards high intensity (in comparison with average temperatures), negative of average intensity (in comparison with the relative air humidity), and weak negative correlations (in comparison withe the precipitations). In order to point out all these correlations, we will give as an exemple two towns situated at extreme altitudes (low altitude, Timisoara, and high altitude, Domasnea).
In Timisoara (100 m altitude) one can observe out of the analysis of the climatic factors, positive correlations given the air temperature (r=0,324; p=0,005), to the soil temperature (r=0,373, p=0,015), and negative, given the humidity (r=-0,279, p=0,015).In Domasnea (557 m altitude), the analysis of the environmental factors correalation shows us direct correlations of low intensity with the air temperature ((r=0,489; p=0,000), respectively soil temperature (r=0,622; p=0,000) and opposite correlations, given the humidity (r=-0,546; p=0,000), respectively the precipitations (r—0,284; p=0,013).
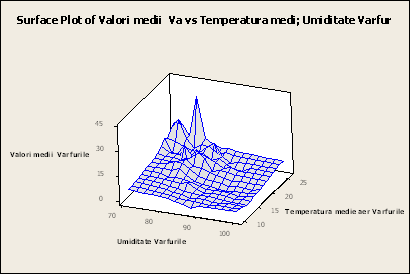
In view of the two factors, temperature and humidity, we can observe that the registred values grow when the humidity is low, and the temperature is high, respectively they drop when the humidity grows and the temperature falls.
The regression curves of the average daily records depending on the climatic factors/altitudes
Town/altitude |
The regression curve of the average daily records depending on the average temperature |
The regression curve of the average daily records depending on the average temperature |
Timisoara 2010 (110 m) |
Values Timisoara = - 57,38 + 51,17
Temp aer Timisoara - 1,002 Temp aer Timisoara**2 |
Values Timisoara = - 77,8 + 5,330
Umiditate Timisoara - 0,04604
Umiditate Timisoara**2 |
Simand 2010 (116 m) |
Daily Averages Simand = - 67,6 + 5,46
Temperatura medie aer Simand + 0,0284 Temperatura medie aer Simand**2 |
Daily Averages Simand = 1780 - 39,20
Umiditate Simand
+ 0,2170 Umiditate Simand**2 |
Covasant 2010 (134 m) |
Daily Averages Covasant = - 54,35 + 5,973 Temperatura medie aer Covasant - 0,0959 Temperatura medie aer Covasant**2 |
Daily Averages Covasant = 963,3 - 21,41 Umiditate Covasant
+ 0,1193 Umiditate Covasant**2 |
Chelmac 2010 (140m) |
Daily Averages Chelmac = - 29,57 + 2,678 Temperatura medie aer Chelmac - 0,0088 Temperatura medie aer Chelmac**2 |
Daily Averages Chelmac = 668,0 - 14,74 Umiditate Chelmac + 0,08189 Umiditate Chelmac**2 |
Soimi 2010 (145 m) |
Daily Averages Soimi = 1,89 - 1,184 Temperatura medie aer Soimi
+ 0,1006 Temperatura medie aer Soimi**2 |
Daily Averages Soimi = 273,7 - 5,073 Umiditate Soimi
+ 0,02317 Umiditate Soimi**2 |
Blaja 2010 (150 m) |
Daily Averages Blaja = 33,91 - 6,985 Temperatura medie aer Blaja + 0,3338 Temperatura medie aer Blaja**2 |
Daily Averages Blaja = 325,1 - 5,367 Umiditate Blaja + 0,01989 Umiditate Blaja**2 |
Gura Vaii 2010 (164 m) |
Daily Averages Gura Vaii = 9,05 - 1,704 Temperatura medie aer Gura Vaii
+ 0,08323 Temperatura medie aer Gura Vaii**2 |
Daily Averages Gura Vaii = 119,9 - 2,015 Umiditate Gura Vaii
+ 0,00817 Umiditate Gura Vaii**2 |
Gurasada 2010 (183 m) |
Averages Gurasada = - 26,26 + 2,703 Temperatura medie aer Gurasada
- 0,02127 Temperatura medie aer Gurasada**2 |
Averages Gurasada = - 274,9 + 7,515 Umiditate Gurasada
- 0,04786 Umiditate Gurasada**2 |
Nusfalau 2010 (214 m) |
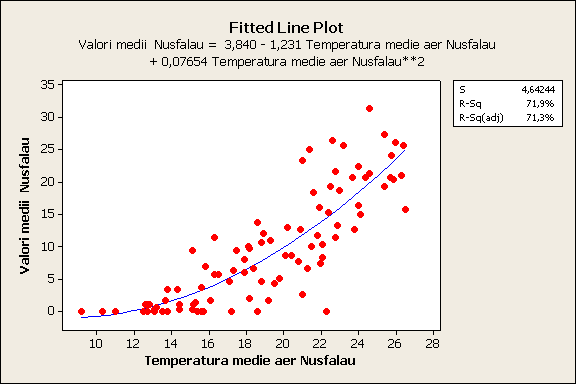
Averages Nusfalau = 3,840 - 1,231 Temperatura medie aer Nusfalau
+ 0,07654 Temperatura medie aer Nusfalau**2 |
Averages Nusfalau = 54,33 - 0,546 Umiditate Nusfalau
- 0,00033 Umiditate Nusfalau**2 |
Varfurile 2010 (228 m) |
Averages Varfurile = 4,97 - 0,909 Temperatura medie aer Varfurile
+ 0,04916 Temperatura medie aer Varfurile**2 |
Averages Varfurile = 239,4 - 4,803 Umiditate Varfurile
+ 0,02408 Umiditate Varfurile**2 |
Prisaca 2010 (270 m) |
Averages Prisaca = 51,09 - 7,511 Temperatura medie aer Prisaca
+ 0,2785 Temperatura medie aer Prisaca**2 |
Averages Prisaca = 50,2 + 0,018 Umiditate Prisaca
- 0,00592 Umiditate Prisaca**2 |
Resita 2010 (305 m) |
valori Resita = - 63,21 + 5,483 Temp Resita - 0,0928 Temp Resita**2 |
valori Resita = - 90,49 + 2,988 umiditate Resita - 0,02140 umiditate Resita**2 |
Teregova 2010 (401 m) |
valori Teregova = - 121,5 + 10,89 Temp Teregova - 0,2181 Temp Teregova**2 |
valori Teregova = - 97,89 + 3,210 umiditate Teregova- 0,02321 umiditate Teregova**2 |
Budureasa 2010 (392 m) |
Valori medii Budureasa = 3,94 - 0,781 Temperatura medie Budureasa + 0,04298 Temperatura medie Budureasa**2 |
Valori medii Budureasa = 88,71 - 1,650 Umiditate Budureasa + 0,007533 Umiditate Budureasa**2 |
Domasnea 2010 (557) |
Valori Domasnea = - 72,12 + 5,915 Temp aer Domasnea - 0,0962 Temp aer Domasnea**2 |
Valori Domasnea = - 0,18 + 0,758 Umiditate Domasnea - 0,008235 Umiditate Domasnea**2 |
In the next graph we exemplify the regression curve for one version of the above centralizing table. This plotting suggestively shows the positive evolution of the records depending on the average air temperature.

The regression curve of the daily average records depending on the average temperature in Nusfalau town (altitude 214 m)

The evolution of the daily average records depending on the daily average temperatures and the humidity in Varfurile town
Following the correaltive evolution (in the exemple above) of the records’ number (individuals) with the climatic factors, one can observe that as the humidity and the volume of precipitaions grow, the number of the records decreases.
|


