Establishing the control points and following the movement direction, of its speed by comparative studies
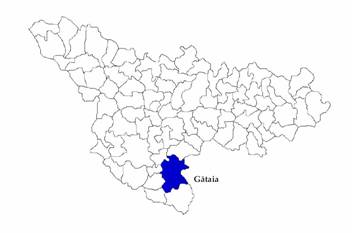
At the altitude of 115 m (Gataia) the highest number of catches were registered in the second decade of July with an average per day / catches 1 and 2 of 70.5 adults. During the entire observation period, there were quantified the values of the 2 traps so that C1+C2 = 2611 samples.
During the months with a maximum activity (July, August), the air and soil temperature grew to a temperature of 30 C which determined a growth of the adults’ number, and the precipitations (50mm) caused a temperature drop and therefore a diminution of the adults’ number/trap.
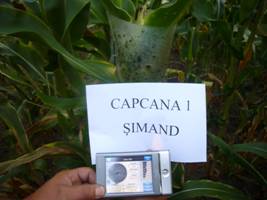
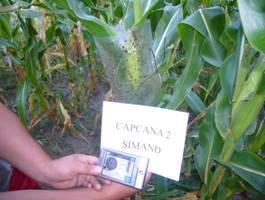
At the same altitude (Simand) the highest number of catches was registered during three periods: the second decade of July with an average day/trap 1 and 2 of 66.5 adults, the first decade of July and the second decade of August.
During the entire observation period, there were quantified the values of the 2 traps so C1+C2 = 3969 samples. Generally, the same rules of correlation are being kept, as they were in the previous case. The wind speed was constant, so that we cannot identify the adults’ number according to the air currents. It is known that the air currents can influence their spreading, and especially their movement direction.
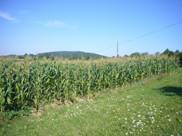 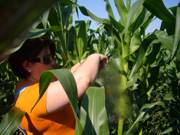 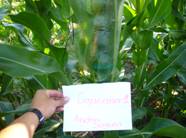
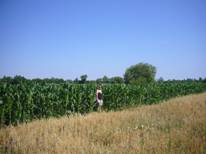
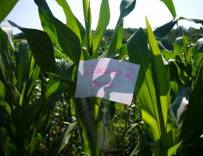
Photos 10,11,12: The observation field (Simand); Setting the pheromone traps
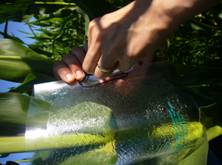
Photos 13,14 Daily catches on trap 1 and 2
At the altitude of 134 m (Covasant), the highest number of catches were registered in the second decade of July with a daily average / trap 1 and 2 of 46.5 adults. During the entire observation period, the total values were C1+C2=2132 samples.
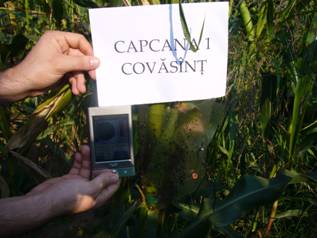
Photo 15- Daily catches on trap 1 (Covasant)
Photos 16,17 - Setting traps; daily catches on trap 2 (Covasant)
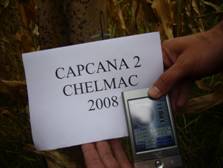
At the altitude of 140 m (Chelmac) the highest number of captures were still registered in the same decade of July when the air and soil temperature was optimal, without any precipitations ( an average per day / trap 1 and 2 of 70.5 adults.). During the entire observation period, there were quantified the values of the 2 traps so that C1+C2=3768 samples.
  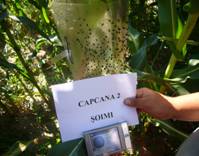
Photos 18,19,20 / The observation field (Soimi), the moment when the trap was set, Daily catches on trap 2
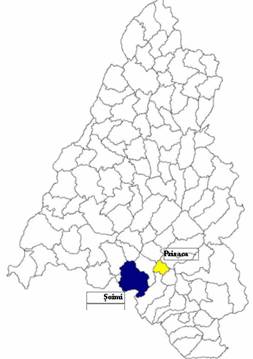
At the altitude of 145 m (Soimi) the highest number of catches were registered in the first decade of August with an average per day/ trap 1 and 2 of 66.5 adults, respectively 64.5 adults. During the entire period of observation, there were quantified the values of the two traps so that C1+C2=2880 samples.
At the altitude of 164 m (Gura Vaii) the highest number of catches were registered in the first decade of August with an average per day/ trap 1 and 2 of 55.5 adults. During the entire observation period, there were quantified the values of the two traps so that C1+C2=2220 samples.
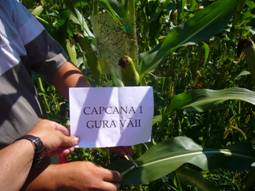 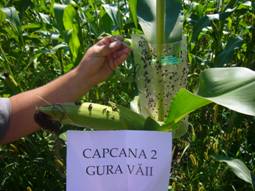
Photos 21,22 - Daily catches on trap 1 and 2 (Gura Vaii)
 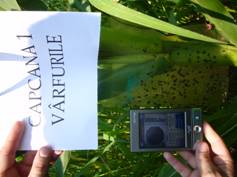
Photos 23,24 - Setting traps; Reading trap 1 (Varfurile)
At the altitude of 228 m (Varfurile) the highest number of catches were registered in the middle of August with an average per day/ trap 1 and 2 of 44.5 adults. During the entire observation period, there were quantified the values of the two traps so that C1+C2= 1872 samples.
 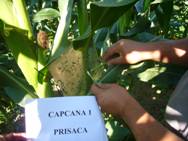 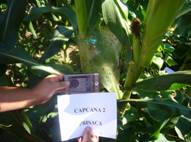
Photos 25,26,27 / Observation field (Prisaca), Reading traps 1 and 2
At the altitude of 270 m (Prisaca) the highest number of catches were registered in the second decade of August with an average per day/ trap 1 and 2 of 13.5 adults. During the entire period of observation, there were quantified the values of the two traps so that C1+C2= 609 samples.
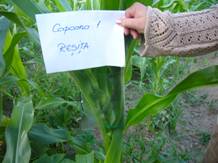 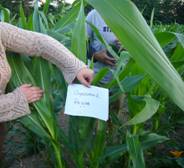
Photos 28,29,30 - Setting the traps 1 and 2 (Resita)
At the altitude of 323 m (Resita) the highest number of catches were registered in the first decade of August with an average per day/ trap 1 and 2 of 31 adults. During the entire observation period, there were quantified the values of the two traps so that C1+C2= 1352 samples.
At the altitude of 396 m (Teregova) the highest number of catches were registered in the third decade of July with an average per day/ trap 1 and 2 of 18.5 adults. During the entire observation period, there were quantified the values of the two traps so that C1+C2= 647 samples.
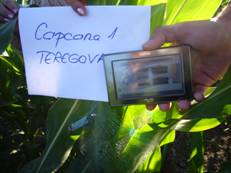 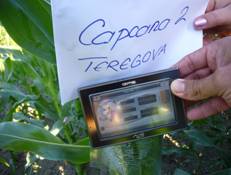
Photos 31,32 - Reading the traps 1 and 2 (Teregova)
At the altitude of 557 m (Domasnea) the highest number of catches were registered in the first decade of August with an average per day/ trap 1 and 2 of 24.5 adults. During the entire observation period, there were quantified the values of the two traps so that C1+C2= 804 samples.
  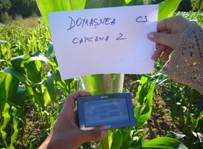
Photos 33,34 - setting traps in a corn crop in Domasnea
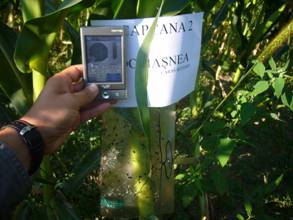 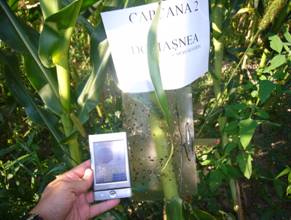
Photos 33,34 / reading the traps 1 and 2 (Domasnea)
The total number of catches at different altitudes
Town |
Altitude |
Total number of captures |
Gataia |
115 |
2611 |
Simand |
115 |
3969 |
Covasant |
132 |
2132 |
Chelmac |
140 |
3768 |
Soimi |
145 |
2880 |
Gura Vaii |
164 |
2220 |
Virfurile |
228 |
1872 |
Prisaca |
270 |
609 |
Resita |
323 |
1352 |
Teregova |
396 |
647 |
Domasnea |
557 |
804 |
If we observe the values from the table, we can say that, at an altitude between 115 and 164, the values of the catches number were a little higher than the one at higher altitudes.
„ Setting of some partial patterns of spreading according to ecological factors”
As a result of statistical patterns, one can observe that there are correlative positive links between the average numbers of catches of Diabrotica virgifera virgifera compared to:
- the average soil temperature;
- the average air temperature.
The correlations established between the average number of catches/day and climatic factors
|
The average air temperature |
The average soil temperature |
Average precipitations |
Wind speed |
Average number of specimen / Chelmac |
-0,22 |
0,71 |
-0,39 |
-0,03 |
Average number of specimen |
-0,22 |
0,73 |
-0,40 |
0,22 |
Average number of specimen / Covasant |
0,03 |
0,66 |
-0,36 |
0,03 |
Average number of specimen / Varfurile |
0,50 |
0,33 |
-0,19 |
-0,05 |
Average number of specimen / Gura Vaii |
0,37 |
0,53 |
-0,29 |
-0,09 |
Average number of specimen / Soimi |
0,62 |
0,59 |
-0,23 |
0,12 |
Average number of specimen / Prisaca |
0,44 |
0,40 |
-0,21 |
0,01 |
Average number of specimen / Resita |
0,48 |
0,40 |
-0,24 |
-0,24 |
Average number of specimen / Teregova |
0,47 |
0,45 |
-0,26 |
-0,22 |
Average number of specimen / Domasnea |
0,50 |
0,41 |
-0,20 |
-0,14 |
Average number of specimen / Gataia |
-0,18 |
-0,14 |
-0,03 |
0,05 |
Correlative positive links between the number of caught specimen and the air temperature were registered in towns like: Soimi (0.62), Domasnea (0.50), Varfurile (0.50).
Also, a positive correlation was obtained between the climatic factor, the air temperature and the number of catches of Diabrotica virgifera virgifera. This correlation was observed in towns like: Chelmac (0.71), Simand (0.73), Covasant (0.66), Gura Vaii (0.53), Soimi (0.59). The negative correlation (-0.78) was registered between the number of specimen of Diabrotica virgifera virgifera and the altitude.
The other climatic factors that were taken into study did not have correlative links with the number of caught specimen, this statement being supported mathematically. To a better visualization of the frequency of the species in different geographical areas, we can observe the partial maps made on climatic conditions from the observation points at different altitudes.
Spreading partial maps
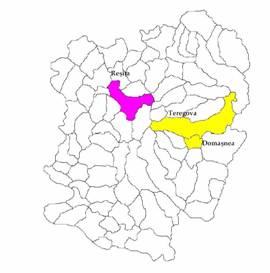 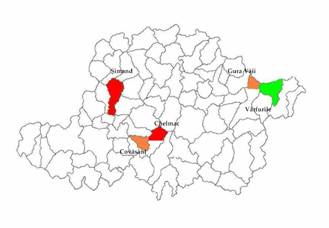
Caras Severin County Arad County
Bihor County Timis County

|
600 -1000 specimen of Diabrotica virgifera virgifera captured / town |
|
|

|
1100-1500 specimen of Diabrotica virgifera virgifera captured / town |
|
|

|
1600 - 2000 specimen of Diabrotica virgifera virgifera captured / town |
|
|

|
2100-2500 specimen of Diabrotica virgifera virgifera captured / town |
|
|

|
2600-3000specimen of Diabrotica virgifera virgifera captured / town |
|
|

|
3100-3500 specimen of Diabrotica virgifera virgifera captured / town |
|
|

|
3600 - 4000 specimen of Diabrotica virgifera virgifera captured / town |
Bibliography
- Alleman D.V., Maize pests in the USA, Maize. Ciba-Geigy, Basel, 58-63 (1979).
- Ball H. J., On the biology and egg laying habits of the western corn rootworm. J. Econ. Entomol., 50, 2, 126-128 (1957).
-
Bartlet R. J., Chiang, H. C., Field studies involving the sex-atractant pheromones of the western and northern corn rootworm beetles, Environ. Entomol., 6, 6, 853-861 (1977).
- Benoit G. R., Mostaghini S., Young R. A., Lindstrom M. J., Tillage residue effects on snow cover, soil water temparatures and frost, Trans ASAE, 29, 473 – 479 (1986).
- Benoit G. R., Young R. A., Lindstrom M. J., Freezing induced field soil water changes during five winters in west central Minesota, Trans ASAE, 31, 1108 – 1114 (1988).
- Chiang H. C., Bionomics of the northern and western corn rootworms, Ann. Rev. Entomol., 18, 47-72 (1973).
- Calkins C.O., Kirk, V. M., Effect of winter precipitation and temperature on overwintering eggs of northern and western corn rootworms, J. Econ. Entomol., 62, 3, 541-543, (1969).
- Edwards R. C., The interaction and impact of soil properties on corn rootworm, IWGO Newsletter, Wien, XXI, 1-2, 5-6 (2000).
- Ellsbury M. M., Woodson W. D., Clay S. A., Malo D., Schumacher J., Clay D. E., Carlson G. G., Geostatical characterization of the spatial distribution of adult corn rootworm emergence, Environ. Entomol., 27, 4, 910 – 917 (1998).
- Hatala- Zseller Ibolya, Szell E., Results of biological observations of Western corn rootworm in 2000 in Hungary, IWGO Newsletter, Wien, XXI, 1-2, 20-21 (2000).
- Krysan J.L., Diapause in the Nearctic species of the Virgifera group of D., Ann. Entomol. Soc. Am., 75, 2, 136-142 (1982).
- Riedell W.E., Sutter G.R., Soil moisture and survival of western corn rootworm in feeld plots, J. Kans. Entomol., Soc., 68, 80-84 (1995).
- Spike B. P., Tollefson, J. J., Westerncom rootworm (Coleoptera: Chrysomelidae) larvae survival and damage potential to corn subjected to nitrogen and plant density treatments, J. Econ. Entomol., 81, 5, 1450-1455 (1988).
|